

When it comes to representing data, you have many options at your disposal. There are many types of graphs and charts that can be used to visually represent information in a way that’s simple to interpret.
Box plots, also known as whisker plots, are one example of these graphs that are used to show data. In this guide on how to draw a box plot, we will show you how to draw a simple version of this graph!
Box Plots come in different forms, but this one will give you a basic idea of how you can create a simple one.
With all that said, we shall begin this step-by-step guide on how to draw a box plot in just six easy steps!
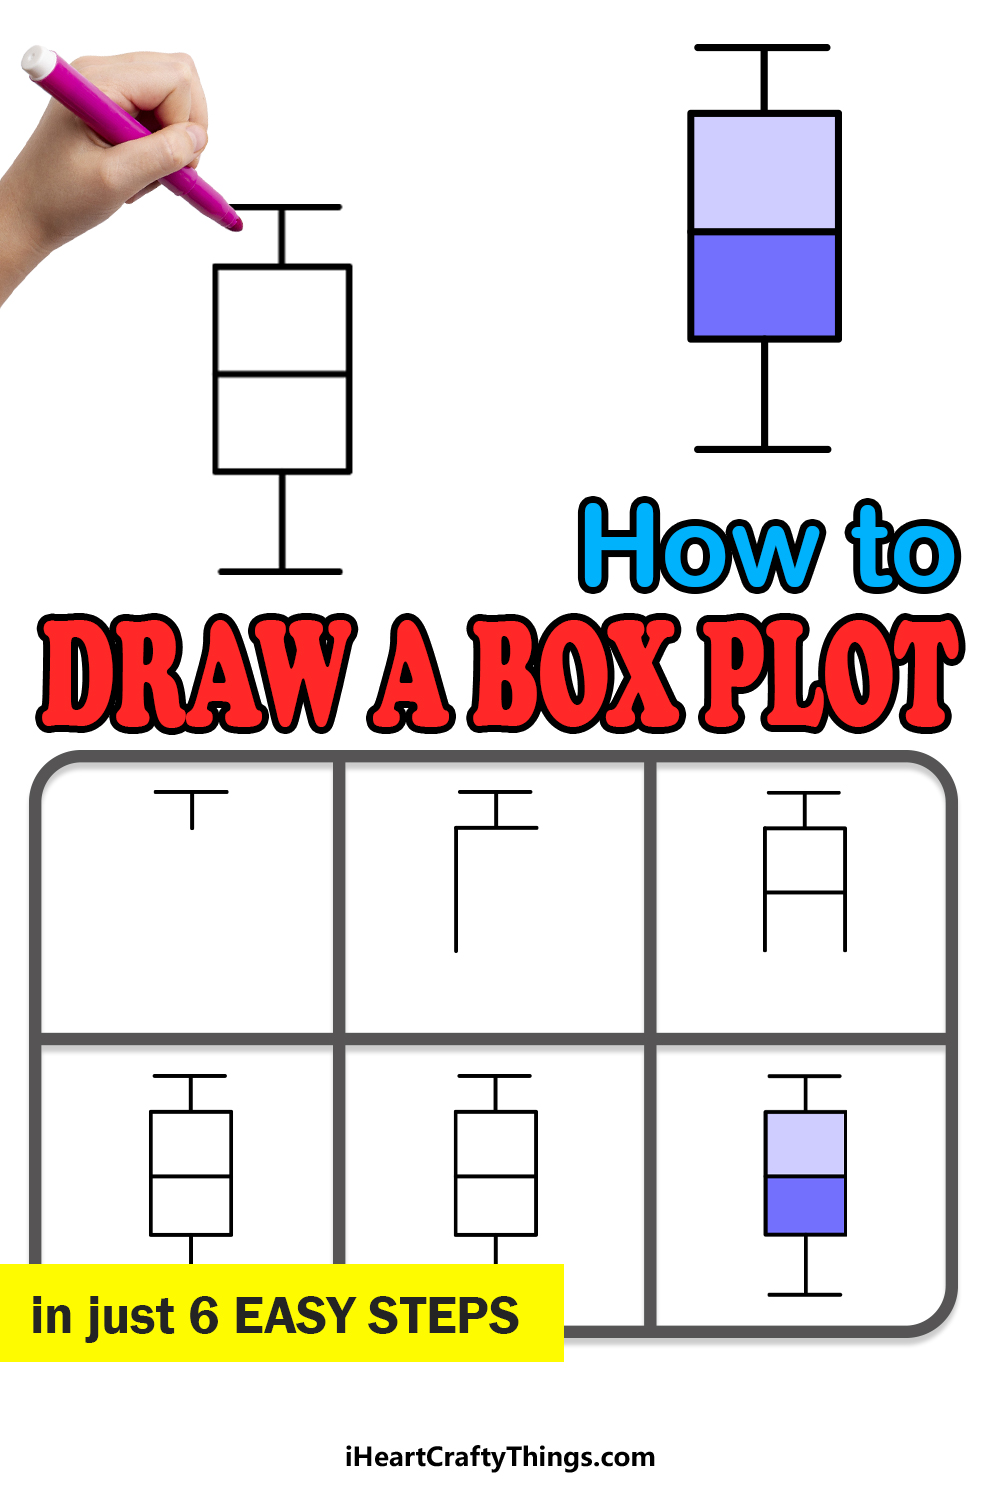
How to Draw A Box Plot – Let’s get Started!
Step 1

For this guide on how to draw a box plot, you will find it much easier to work on if you use a ruler to help you with all of the straight lines.
We also won’t be covering the specifics of how to represent data on a box plot in too much detail, as that’s a whole different matter!
Instead, we will focus on the fundamentals of drawing the box plot structure.
To begin, we will keep things nice and simple. We will be drawing what looks a little like a flat letter T.
Simply draw a horizontal line for the top of this part using your ruler, and then draw a short line coming down from it.
This section is part of how the data is represented on the graph, and it will vary depending on the data.
Step 2 – Draw the body of the box plot

To continue this box plot drawing, we can now start drawing the body of the graph. This is drawn as a rectangular shape, and we will begin the first part of it now.
First, use your ruler to draw another horizontal line at the base of the T shape you just drew.
Then, using your ruler you can draw a vertical line coming down from the left-hand side.
Using a tool such as a set square can make this much easier to do, as you ideally want a right angle for this part. Then, it’s on to step 3!
Step 3 – Now, draw the next section of the body

Now it’s time to add the next section of the box plot’s body! First, draw another straight, vertical line down from the right-hand side of the line underneath the T shape.
Once that is drawn, we will then add another horizontal line across the center of the body.
As we mentioned earlier, many of these details will vary depending on the data that’s being represented, and the way we’re drawing it here is just a basic example.
When you have added this line, we can finish off the body in the next step.
Step 4 – Finish the body of the box plot
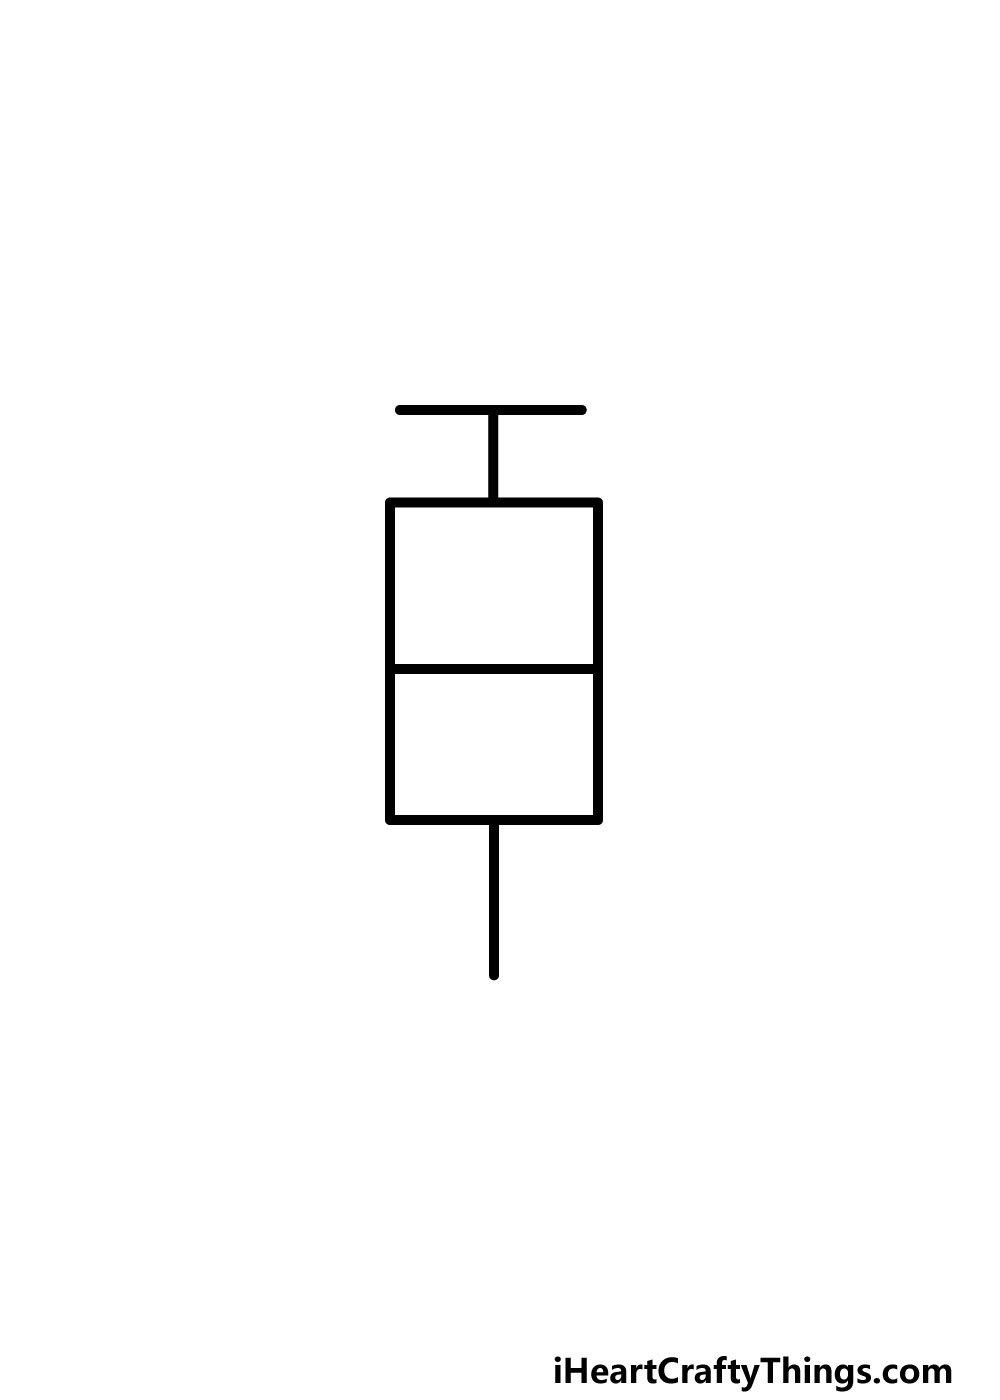
In this step of our guide on how to draw a box plot, we will finish off the body of the graph. Finish off the rectangular shape by adding one more horizontal line at the base of the graph.
When this rectangular body is complete, we will then begin the final section. To begin this, simply draw another straight line down from the center of the base of the rectangle.
This one will be longer than the vertical line for the top T shape, but it will also vary depending on the data. Then, you will be ready for the final details of the drawing!
Step 5 – Now, you can add in the final details of this box plot
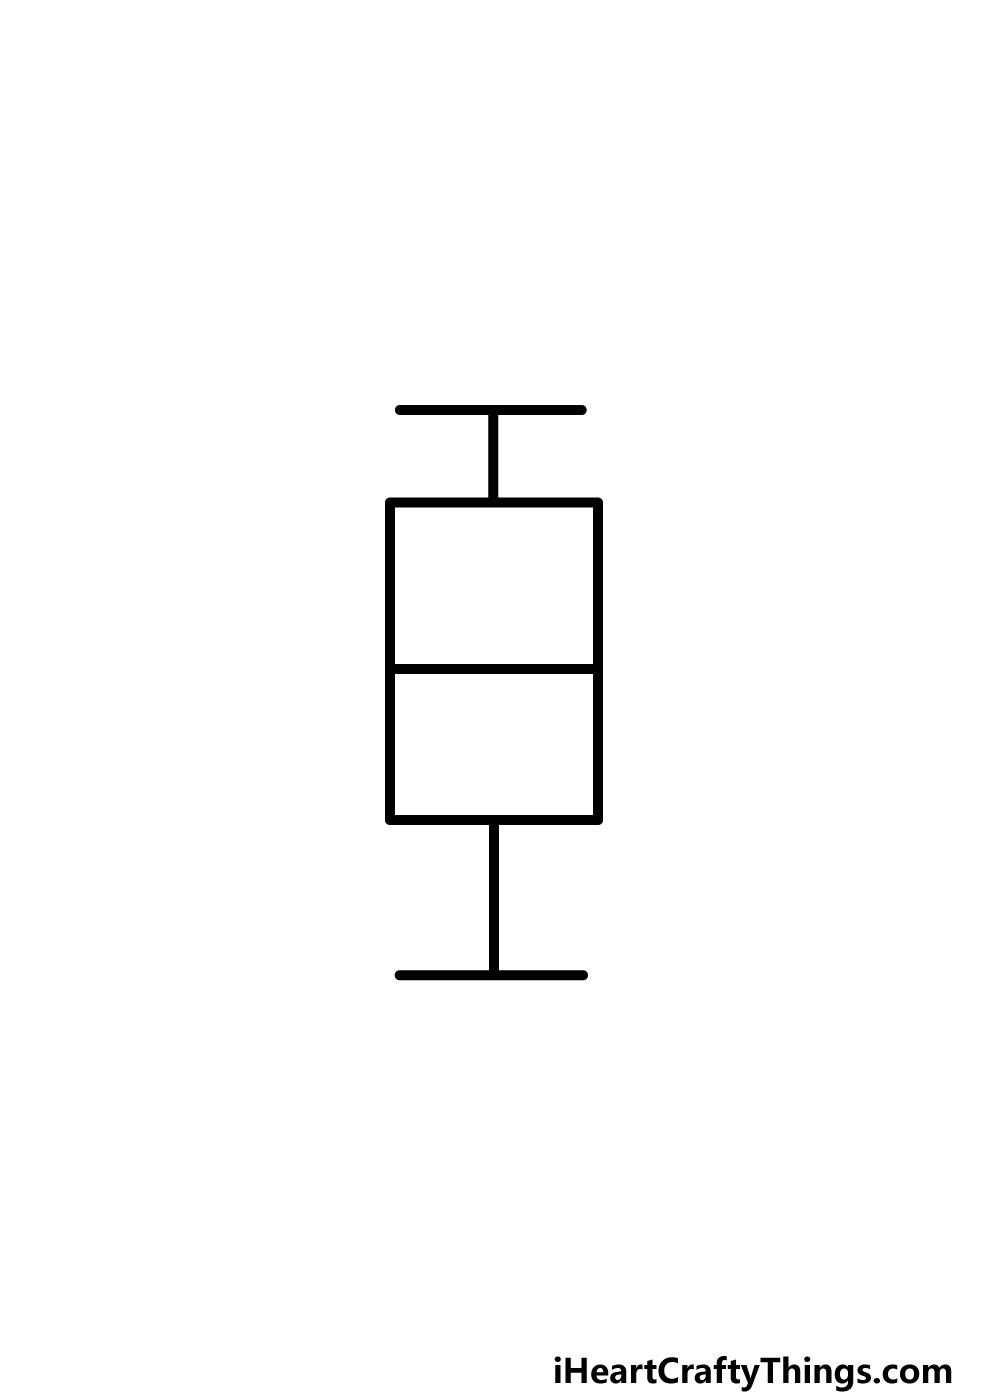
The final line of this box plot drawing should be easy enough to add! All you need to do is draw another small horizontal line to form the base of the upside-down T shape at the base of the box plot.
Once that line is drawn, you have successfully learned how to draw a basic box plot shape!
As we’ve mentioned a few times in this guide, the structure will vary depending on what you are using the box plot to represent.
There are also extra details that are added to these graphs to represent further data.
For example, small dots can be added around the T shapes to show certain values and how they relate to the other data.
What will you be using this box plot to represent? You can add some text to show off what you would be using this one for!
Step 6 – Finish off your box plot drawing with some color
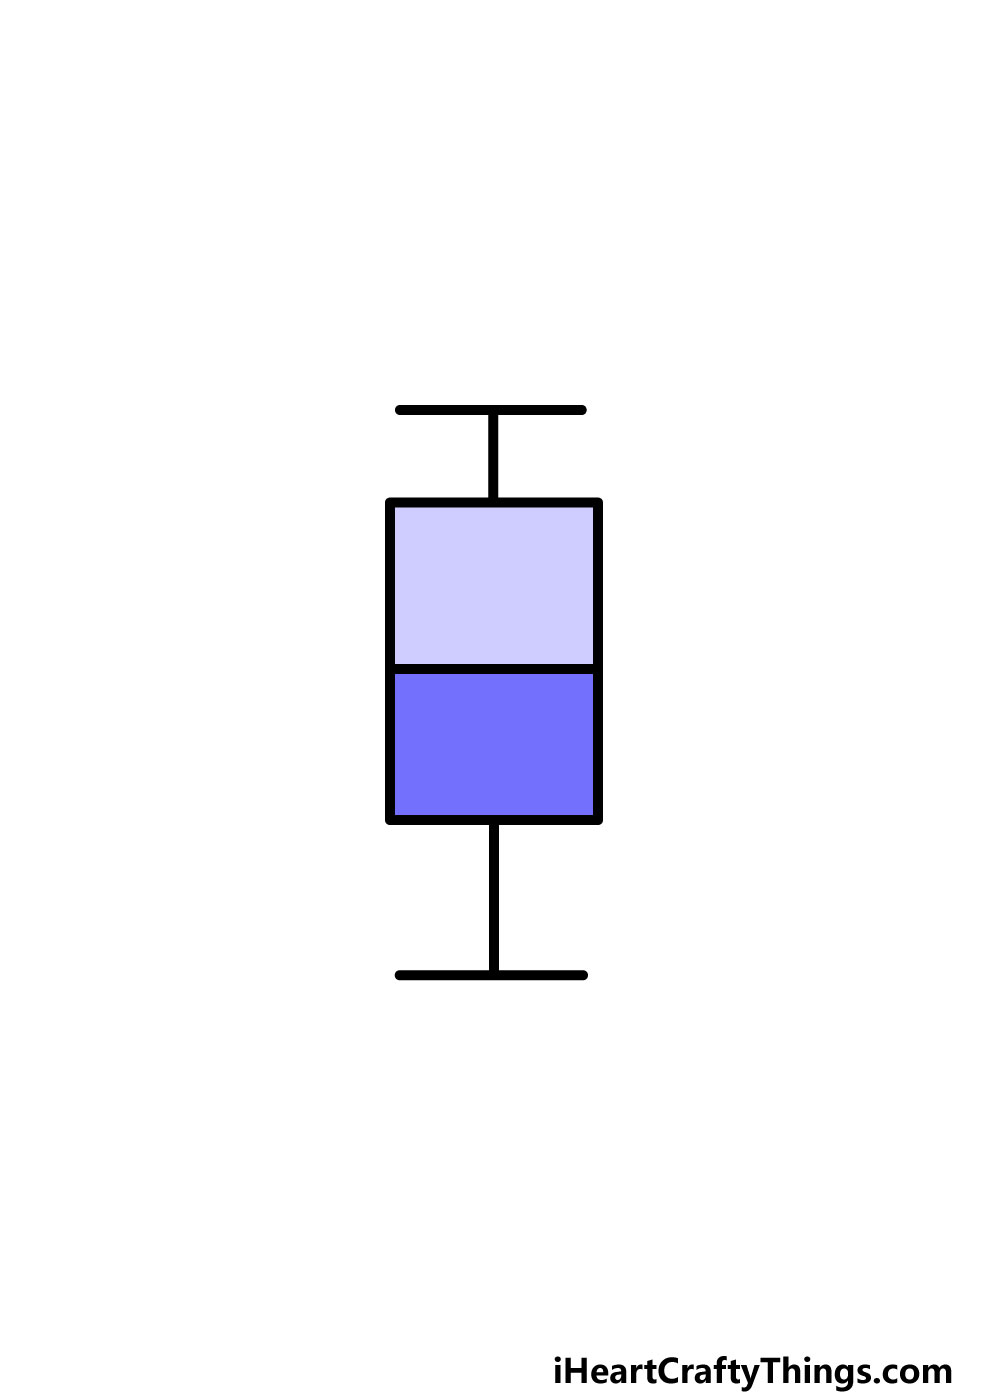
When it comes to this kind of drawing, the colors you use are completely up to you!
The colors you use can also be used as a tool to help make the data you’re representing easier to interpret, so you can put some thought into what colors you think would be best.
In our example, we used a light lavender purple for the top half of the rectangle. Then we used a slightly darker purple for the other half.
When coloring this graph, we would recommend using colored pens or markers to make the colors vibrant and clear!
What colors will you use to finish off this box plot graph?
3 More tips to make your box plot drawing easy!
Make your box plot sketch a lot easier with these easy tips.
This drawing of a box plot may look simple on the surface of it, but it can be surprisingly tricky. For this reason, you may want to consult some existing box plots to help you with this one.
While the structure of the box plot may not be that complicated, it can get trickier when it comes to actually representing data. This is where looking at images of real box plots could be helpful.
You could look some up online or find some in textbooks if you need some assistance. See how these ones went about showing the data, and then you can use that for whatever you are trying to represent.
Once you have the hang of how data is represented on a box plot, you could use a pencil to help you prepare for creating your very own box plot.
Using a pencil is recommended for any drawing, as it can allow you to plan it out without committing to the final lines. It is especially useful for images that require precision, such as this one.
Once you have gotten it exactly as you want it, you can then use a more permanent medium such as a pen to draw over the pencil lines, which you can then erase.
If you find that you simply cannot get the hang of creating this box plot sketch, there are a few more ways that you can get around it. One would be using a rectangular stencil.
This will make drawing the outline and making a perfect shape much easier. Once you have that outline, you can then focus on adding the other lines that represent the data.
If you don’t have a proper stencil, then you could use another small, rectangular object to trace around or perhaps a set square to aid you.
If all else fails, you could print out a small rectangle digitally and then draw the extra details and lines straight onto it.
Your Box Plot Drawing is Complete!
That will conclude this guide on how to draw a box plot! This is a unique and involved method for representing data, but it is also efficient in its simplicity.
The graphs you create may not look exactly the same as ours and there is a bit more to it when data becomes involved, but we hope that these steps made the basics easy for you!
Now you can take what you have learned to create your own box plots that show off data and statistics that you want to convey.
It would be very interesting to see what you have in mind for this box plot!
When you are ready to try out a new drawing, you can check out our website for more drawing guides to enjoy.
These feature everything from animals to famous cartoon characters, so there’s sure to be a guide to catch your eye!
Lastly, we would be very interested to see what you did to finish this box plot drawing! You can share your creation on our Facebook and Pinterest pages for us to see when it’s done.